 Explorbot
Observability & Debugging
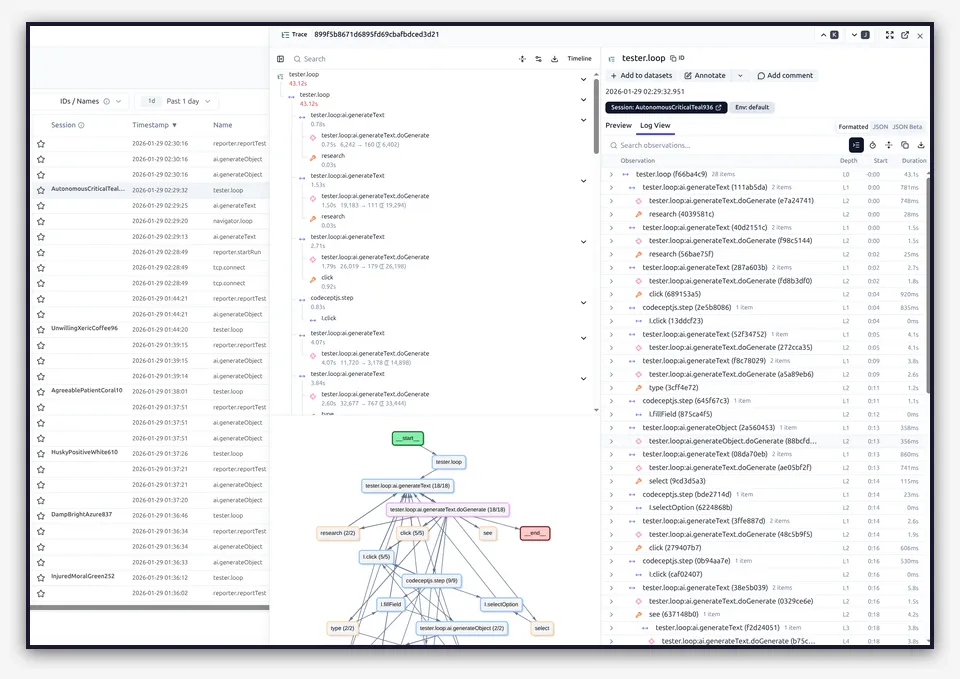
Explorbot integrates with Langfuse for tracing. Use it to see what happened during a session: what data each agent received, which tools it called, and how it decided.
Why Observability?
Section titled “Why Observability?”Without traces, you only see the final test result and basic logs. When Explorbot runs on its own, you need to see:
- What prompts went to the AI.
- What tools were called, and with what parameters.
- Token usage and cost per session.
- How long each operation took.
- Errors and retries.
Use this data to:
- Debug failed tests. See what the AI saw and decided.
- Create Knowledge fixes. Find the context that was missing.
- Tune prompts and agent performance.
- Understand why a test passed or failed.
- Export sessions for the
/explorbot-debugskill.
Setting Up Langfuse
Section titled “Setting Up Langfuse”1. Create a Langfuse Account
Section titled “1. Create a Langfuse Account”Sign up at langfuse.com (free tier available) or self-host.
2. Get Your API Keys
Section titled “2. Get Your API Keys”From your Langfuse project settings, copy:
- Public Key
- Secret Key
3. Configure Explorbot
Section titled “3. Configure Explorbot”Add credentials to your .env file:
LANGFUSE_PUBLIC_KEY=pk-lf-xxxxxxxxLANGFUSE_SECRET_KEY=sk-lf-xxxxxxxxOr configure in explorbot.config.js:
export default { ai: { model: groq('gpt-oss-20b'), langfuse: { enabled: true, publicKey: process.env.LANGFUSE_PUBLIC_KEY, secretKey: process.env.LANGFUSE_SECRET_KEY, baseUrl: 'https://cloud.langfuse.com', // or your self-hosted URL }, },};4. Run Explorbot
Section titled “4. Run Explorbot”Once configured, Explorbot traces every AI call. No code changes needed.
What Gets Traced
Section titled “What Gets Traced”Explorbot uses the Vercel AI SDK integration with Langfuse. Each session captures:
| Trace | Description |
|---|---|
test: <scenario> | Full test execution cycle |
researcher: <url> | Page analysis by Researcher agent |
planner: <url> | Test scenario generation |
driller: <url> | Component drilling |
ai.generateText | Text generation calls |
ai.generateObject | Structured output calls |
codeceptjs.step | Individual browser actions |
Navigator has no span of its own — its AI calls appear as ai.* spans under the parent trace.
Analyzing Sessions
Section titled “Analyzing Sessions”In Langfuse Dashboard
Section titled “In Langfuse Dashboard”- Open your Langfuse project
- Find the session by timestamp or name
- Click to see the full trace tree
- Inspect individual spans for:
- Input prompts
- Output responses
- Token counts
- Duration
- Errors
Debugging with Claude Code
Section titled “Debugging with Claude Code”Explorbot includes a Claude Code skill that analyzes failed sessions.
Using the Debug Skill
Section titled “Using the Debug Skill”Find the failed test: <scenario> trace in Langfuse and copy its trace ID. Then, in Claude Code, run:
/explorbot-debugGive it the trace ID — the skill fetches the trace with all its observations via bun .claude/skills/explorbot-debug/langfuse-export.ts <trace-id>. The trace holds the full context: prompts, tool calls, page states, and AI decisions. Without a trace ID, the skill analyzes output/explorbot.log instead.
What the Skill Analyzes
Section titled “What the Skill Analyzes”The skill looks for three failure patterns:
| Pattern | Symptoms | Solution |
|---|---|---|
| Missing Context | Wrong element clicked, didn’t understand UI | Add Knowledge file with disambiguation rules |
| Wrong Prompts | Incorrect assumptions, wrong flow | Add Knowledge with business context |
| Wrong Tool Choice | Used click when form needed, typing issues | Add Knowledge with CodeceptJS code examples |
How It Helps
Section titled “How It Helps”-
Extracts key data from the trace with jq:
- Failed tool calls
- URLs visited
- Prompts sent to the AI
-
Identifies the root cause of failures.
-
Suggests Knowledge files to fix the issue:
---url: /admin/users/*---## User TableEach row has same buttons. Use container:I.click('Delete', '[data-user-id="123"]') -
Can try interactions with browser tools, if available, and record working CodeceptJS code.
Example Workflow
Section titled “Example Workflow”# 1. Test fails./bin/explorbot-cli.ts explore /admin/users
# 2. Open Langfuse, find the failed "test: ..." trace, copy its trace ID
# 3. In Claude Code:/explorbot-debug# Provide the trace ID
# 4. Skill analyzes and suggests Knowledge fix# 5. Create knowledge file./bin/explorbot-cli.ts learn "/admin/users/*" "Use container context for table actions"
# 6. Re-run testDebugging Tips
Section titled “Debugging Tips”Enable Verbose Logging
Section titled “Enable Verbose Logging”./bin/explorbot-cli.ts explore /admin/users --verboseOr set the environment variable:
DEBUG=explorbot:* ./bin/explorbot-cli.ts explore /admin/usersThis shows detailed logs:
- Prompts sent to the AI
- Tool calls and results
- State transitions
Specific Debug Namespaces
Section titled “Specific Debug Namespaces”# AI provider calls onlyDEBUG=explorbot:provider ./bin/explorbot-cli.ts explore /admin/users
# Navigator agent onlyDEBUG=explorbot:navigator ./bin/explorbot-cli.ts explore /admin/users
# Multiple namespacesDEBUG=explorbot:tester,explorbot:navigator ./bin/explorbot-cli.ts explore /admin/usersAvailable Namespaces
Section titled “Available Namespaces”| Namespace | What it shows |
|---|---|
explorbot:provider | AI API calls, responses |
explorbot:provider:out | Outgoing prompts |
explorbot:provider:in | Incoming responses |
explorbot:navigator | Navigation decisions |
explorbot:researcher | Page analysis |
explorbot:planner | Test scenario generation |
explorbot:tester | Test execution |
explorbot:historian | Experience saving |
explorbot:quartermaster | A11y analysis |
Cost Tracking
Section titled “Cost Tracking”Langfuse tracks token usage per call. Use it to:
- Monitor cost across sessions
- Compare model efficiency
- Find expensive operations
- Tune prompts to reduce tokens
Self-Hosting Langfuse
Section titled “Self-Hosting Langfuse”For privacy or compliance, you can self-host Langfuse. Langfuse v3 requires docker compose with Postgres, ClickHouse, and Redis — follow the self-hosting docs.
Then set baseUrl in your config:
langfuse: { baseUrl: 'http://localhost:3000',}